52 KiB
Monitoring, Managing, and Maximizing Google Cloud Operations (GCP DevOps Engineer Track Part 4)
Introduction
About the Course and Learning Path
Make better software, faster
Milestone: Getting Started
Understanding Operations in Context
Section Introduction
What Is Ops?
-
GCP Defined
-
"Monitor, troubleshoot, and improve application performance on your Google Cloud Environment"
-
Logging Management
- Gather Logs, metrics and traces everywhere
- Audit, Platform, User logs
- Export, Discard, Ingest
- Audit, Platform, User logs
- Gather Logs, metrics and traces everywhere
-
Error Reporting
- So much data, How do you pick out the important indicators?
- A centralized error management interface that shows current & past errors
- Identify your app's top or new errors at a glance, in a dedicated dashboard
- Shows the error details such as time chart, occurences, affected user count, first- and last- seen dates as well as a cleaned exception stack trace
- So much data, How do you pick out the important indicators?
-
Across-the-board Monitoring
- Dashboards for built-in and customizable visualisations
- Monitoring Features
- Visual Dashboards
- Monitoring Features
- Health Monitoring
- Associate uptime checks with URLs, groups, or resources (e.g. instances and load balancers)
- Service Monitoring
- Set, monitor and alert your teams as needed based on Service Level Objectives (SLO's)
- Dashboards for built-in and customizable visualisations
-
SRE Tracking
- Monitoring is critical for SRE
- Google Cloud Monitoring enables the quick and easy development of SLIs and SLOs
- Pinpoint SLI's and develop and SLO on top of it
- Google Cloud Monitoring enables the quick and easy development of SLIs and SLOs
- Monitoring is critical for SRE
-
Operational Management
- Debugging
- Inspects the state of your application at any code location in production without stopping or slowing down requests
- Latency Management
- Provides latency sampling and reporting for App Engine, including latency distributions and per-URL statistics
- Performance Management
- Offers continuous profiling of resource consumption in your production applications along with cost management
- Security Management
- With audit logs, you have near real-time user activity visibility across all your applications on Google Cloud
- Debugging
-
What is Ops: Key Takeaways
- Ops Defined: Watch, learn and fix
- Primary services: Monitoring and Logging
- Monitoring dashboads for all metrics, including health and services (SLOs)
- Logs can be exported, discarded, or ingested
- SRE depends on ops
- Error alerting pinpoints problems, quickly
Scratch:
- Metric query and tracing analysis
- Establish performance and reliability indicators
- Trigger alerts and error reporting
- Logging Features
- Error Reporting
- SRE Tracking (SLI/SLO)
- Performance Management
Clarifying the Stackdriver/Operations Connection
- 2012 - Stackdriver Created
- 2014 - Stackdriver Acquired by Google
- 2016 - Stackdriver Released: Expanded version of Stackdriver with log analysis and hybrid cloud support is made generally available
- 2020 - Stackdriver Integrated: Google fully integrates all Stackdriver functionality into the GCP platform and drops name
Cloud Monitoring, CLoud Logging, Cloud Trace, Cloud Profiler, Cloud Debugger, Cloud Audit Logs (formerly all called Stackdriver )
"StackDriver" lives on - in the exam only
Integration + Upgrades
- Complete UI Integrations
- All of Stackdrivers functionality - and more - is now integrated into the Google Cloud console
- Dashboard API
- New API added to allow creation and sharing of dashoards across projects
- Log Retention Increased
- Logs can now be retained for up to 10 years and you have control over the time specified
- Metrics Enhancement
- In Cloud Monitoring, metrics are kept up to 24 months, and writing metrics has been increased to a 10-second granularity (write out metrics every 10 seconds)
- Advanced Alert Routing
- Alerts can now be routed to independent systems that support Cloud Pub/Sub
Operations and SRE: How Do They Relate?
- Lots of questions in Exam on SRE
What is SRE? - "SRE is what happens when a software engineer is tasked with what used to be called operations" (Founder Google SRE Team)
Pillars of DevOps
-
Accept failure as normal:
- Try to anticipate, but...
- Incidents bound to occur
- Failures help team learn
-
No-fault postmortems & SLOs:
- No two failures the same
- Track incidents (SLIs)
- Map to Objectives (SLOs)
-
Implement gradual change:
- Small updates are better
- Easier to review
- Easier to rollback
-
Reduce costs of failures:
- Limited "canary" rollouts
- Impact fewest users
- Automate where possible
-
Measure everything:
- Critical guage of sucess
- CI/CD needs full monitoring
- Synthetic, proactive monitoring
-
Measure toil and reliability:
- Key to SLOs and SLAs
- Reduce toil, up engineering
- Monitor all over time
SLI: "A carefully defined quantitative measure of some aspect of the level of service that is provided"
SLIs are metrics over time - specific to a user journey such as request/response, data processing, or storage - that show how well a service is doing
Example SLIs:
- Request Latency: How long it takes to return a response to a request
- Failure Rate: A fractice of all rates recevied: (unsuccessful requests/all requests)
- Batch Throughput - Proportion of time = data processing rate > than a threshold
Commit to Memory - Google's 4x Golden Signals!
- Latency
- The time is takes for your service to fulfill a request
- Errors
- The rate at which your service fails
- Traffic
- How much demand is directed at your service
- Saturation
- A measure of how close to fully utilized the services' resources are
LETS
SLO: "Service level objectives (SLOs) specify a target level for the reliability of your service" - The site reliability workbook
SLOs are tied to you SLIs
- Measured by SLLI
- Can be a single target value or range of values
- SLIs <= SLO
- or
- (lower bound <= SLI <= upper bound) = SLO
- Common SLOs: 99.5%, 99.9%, 99.99% (4x 9's)
SLI - Metric over time which detail the health of a service
- example:
Site homepage latency requests < 300ms over last 5 minutes @ 95% percentile
SLO - Agreed-upon bounds how often SLIs must be met
- example:
95% percentile homepage SLI will suceed 99.9% of the time over the next year
Phases of Service Lifetime
SRE's are involved in the architecture and design phase, but really hit their stride in the "Limited Availability" (operations) phase. This phase typically includes the alpha/beta phases, and provides SRE's great opportunity to:
- Measure and track SLIs (Measuring increasing performance)
- Evaluate reliability
- Define SLOs
- Build capacity models
- Establish incident response, shared with dev team
General Availability Phase
- After Production Readiness Review passed
- SREs handle majority of op work
- Incident responses
- Track operational load and SLOs
Ops & SRE: Key Takeaways
- SRE: Operations from a software engineer
- Many shared pillars between DevOps/SRE
- SLIs are quantitative metrics over time
- Remember the 4x Google Golden Signals (LETS)
- SLOs are a target objective for reliability
- SLIs are lower then SLO - or - in-between upper and lower bound
- SREs are most active in limited availability and general availability phases
Operation Services at a Glance
10,000ft view!
- Cloud Monitoring - Provides visibility into the performance, uptime, and overall health of cloud-powered applications
- Cloud Logging - Allows you to store, search, analyze, monitor and alert on log data and events from GCP
Gives SRE's the ability to evaluate SLI's and keep on track with SLO's
Help make operations run smoother, reliabily and more efficiently
- Cloud Debugger - When and not if the system encounters issues, lets you inspect the state of a running application in real-time without interference
- Cloud Trace - Maps out exactly how your service is processing the various requests and responses it receives, all while tracking latency
- Cloud Profiler - Keeps an eye on your codes performance - Continuously gather CPU usage and memory-allocation information from your production applications, looking for bottlenecks
Ops Tools Working Together
Gather Information
- Collect signals
- Through Metrics
- Apps
- Services
- Platform
- Microservices
- Logs
- Apps
- Services
- Platform
- Trace
- Apps
- Through Metrics
Handle Issues
- Alerts
- Error Reporting
- SLO
Troubleshoot
Display and Investigate
- Dashboards
- Health Checks
- Log Viewer
- Service Monitoring
- Trace
- Debugger
- Profiler
5x Main Services Are:
- Cloud Monitoring
- Cloud Logging
- Cloud Debugger
- Cloud Trace
- Cloud Profiler
All work together to gather info, manage instance and troubleshoot, by allowing you to display the collective signals and analyze them
Section Review
Monitoring, troubleshooting and improving applications performance.
Milestone: The Weight of the World (Teamwork, Not Superheroes)
Monitoring Your Operations
Section Introduction
Cloud Monitoring Concepts
Measures key aspects of your services
- Captures resource and application signal data
- Metrics
- Events
- Metadata
What questions does Cloud Monitoring answer?
- How well are my resources performing?
- Are my applications meeting their SLAs?
- Is something wrong that requires immediate action?
Workspace - 'Single pane of glass' for viewing and monitoring data across projects Installed Agents (optional) - Additional application-specifc signal data Alerts - Notify someone when something needs to be fixed
Monitoring Workspaces Concepts
What is a monitoring Workspace?
- GCP's organization tool for monitoring GCP and AWS resources
- All montioring tools live in a Workspace
- Uptime checks
- Dashboards
- Alerts
- Charts
- All montioring tools live in a Workspace
Monitoring Workspace (within a project) ------ (One of More GCP Projects) ------< GCP Projects
- Workspace exists in a Host Project - Create project first, then Monitoring Workspace within the project
- Projects can only contain a single Workspace
- Workspace name same as host project (cannot be changed) - Workspace name will be same as
project_id(worth having a project dedicated to the workspace name) - Workspace can monitor resources in same projects and/or other projects
- Workspace can monitor multiple projects simultaneously
- Projects associated with a single workspace
- Projects can be moved from one workspace to another
- Two different workspaces can be merged into a single workspace
- Workspace access other projects' metric data, but data 'lives' in those projects
Project Grouping Strategies - No single correct answer
Single workspace can monitor upto 200 projects
- A single workspace for all app-related projects "app1"
- Pro: Single pane of glass for all application/resource data for single app
- Con: If need to restrict dev/prod teams from viewing data in each others projects. Too broad access
- 2x Workspaces for viewing projects in each tier e.g. Dev/Prod/QA/Test
- Limited scope so can restrict teams
- More than one place to investigate should you need to
- Single Workspace per project
- Maximum isolation
- More limited view
Monitoring Workspaces IAM roles
- Applied to workspace project to view add projects' monitoring data
- Monitoring Viewer/Editor/Admin
- Viewer = Read-only access (view metrics)
- Editor = Edit workspace, write-access to monitor console and API
- Admin = Full access including IAM roles
- Monitoring Metric Writer = Service Account role
- Permit writing data to workspace
- Does not provide read access
Monitoring Workspaces
-
Creating a workspace
Operations > Monitoring > Overview- Select a project, and workspace is created for that project
-
Adding projects to a workspace
- Within Overview >
Settings > GCP Projects Section > Add GCP Projects
- Within Overview >
-
Moving projects between workspaces
- Goto Workspace where project is located that you want to move
Settings > 'GCP Projects' Section > Select 3x Little dots on line of project you want to move > 'Move to another workspace'- If you're moving a project where you've created custom dashboards in the current workspace, these will be lost
- Goto Workspace where project is located that you want to move
-
Merging workspaces
- Navigate into the workspace that you want to merge into (
ws-1):Settings > MERGEand select the workspace (ws-2) you want to move into your current workspace (ws-1)- Merge
ws-2intows-1wherebyws-2is deleted as part of the process
- Merge
- Navigate into the workspace that you want to merge into (
Note: Cloud playgrounds will only have a single project
Perspective: Workspaces in Context
How can you make all the data easier to manage? e.g. Don't dump everything into one workspace
What Are Metrics?
- Workspace provides visibility into everything that is happening in your GCP resources
- Within Workspace, we view information using:
- Metrics
- ...viewed in Charts...
- ...grouped in Dashboards...
What are Metrics?
- Raw data GCP uses to create charts
- Over 1000 pre-created metrics
- Can create custom metrics
- Built in Monitoring API
- OpenCensus - open source library to create metrics
- Best practice: don't create a custom metric where a default metric already exists
Anatomy of a Metric
-
Value Types - metric data type
- BOOL - boolean
- INT64 - 64-bit integer
- DOUBLE - Double precision float
- STRING - a string
-
Metric Kind - relation of values
- Guage - Measure specific instant in time (e.g. CPU Utilization)
- Delta - Measure change since last recording (e.g. requests count since last data point)
Exploring Workspace and Metrics
Video just does a quick walkthrough of the dashboard and creating a chart with the metrics explorer
Monitoring Agent Concepts
-
CLoud Monitoring collects lots of metrics with no additional configuration needed
- "Zero config monitoring"
- Examples: CPU utilization, network traffic
-
More granular metrics can be collected using an optional monitoring agent
- Memory usage
- 3rd Party app metrics (Nginx, Apache)
-
Separate agent for both monitoring and logging
-
Monitoring Agent = collectd
-
Logging Agent = fluentd
Which GCP (and AWS) Services Need Agents?
- Not all compute services require (or even allow installation of) agents
- Services that support agent installation:
- Compute Engine
- AWS EC2 instances (required for all metrics)
- Services which don't support agent installation:
- Everything else
- Managed services either have an agent already installed or simply don't require one
- Google Kubernetes Engine has Cloud Operations for GKE pre-installed
Installing the Agent - General Process
- Add installation location as repo
- Update repos
- Install agen from repo ('apt install ...')
- (Optional) Configure agent for 3rd party application
Installing the Monitoring Agent
- Manually install and configure monitoring agent on Apache web server
- Demonstrate how to automate the agent setup process
The below commands will create an instance with a custom web page. The first instance does not have the agent installed, and the second instance is with the agent installed. You will need to allow port 80 on your VPC firewall if it's not already enabled, scoped to your instance tag (command included for reference).
Create the firewall rule, allowing port 80 access on the default VPC (modify if using a custom VPC):
gcloud compute firewall-rules create default-allow-http --direction=INGRESS --priority=1000 --network=default --action=ALLOW --rules=tcp:80 --source-ranges=0.0.0.0/0 --target-tags=http-server
Create a web server without an agent:
gcloud beta compute instances create website-agent --zone=us-central1-a --machine-type=e2-micro --metadata=startup-script-url=gs://acg-gcloud-course-resources/devops-engineer/operations/webpage-config-script.sh --tags=http-server --boot-disk-size=10GB --boot-disk-type=pd-standard --boot-disk-device-name=website-agent
Create web server and install an agent: (The Automated Example)
gcloud beta compute instances create website-agent --zone=us-central1-a --machine-type=e2-micro --metadata=startup-script-url=gs://acg-gcloud-course-resources/devops-engineer/operations/webpage-config-with-agent.sh --tags=http-server --boot-disk-size=10GB --boot-disk-type=pd-standard --boot-disk-device-name=website-agent
To manually install the agent (with Apache configuration) on an instance:
- Add the agent's package repository
curl -sSO https://dl.google.com/cloudagents/add-monitoring-agent-repo.sh
sudo bash add-monitoring-agent-repo.sh
sudo apt-get update
- To install the latest version of the agent, run:
sudo apt-get install stackdriver-agent
- To verify that the agent is working as expected, run:
sudo service stackdriver-agent status
- On your VM instance, download apache.conf and place it in the directory /opt/stackdriver/collectd/etc/collectd.d/:
(cd /opt/stackdriver/collectd/etc/collectd.d/ && sudo curl -O https://raw.githubusercontent.com/Stackdriver/stackdriver-agent-service-configs/master/etc/collectd.d/apache.conf)
- Restart the monitoring agent:
sudo service stackdriver-agent restart
Collecting Monitoring Agent Metrics
- Generate traffic to our Apache web server
- View web server metrics in Cloud Monitoring Workspace
When you have the agent installed, you can see 2x new tabs depending on what's been configured. In the example "Agent" & "Apache" are visible with associated metrics that wouldn't otherwise be there
Integration with Monitoring API
What is the Monitoring API?
- Manipulate metrics utilizing Google Cloud API's
- Accessible via external services
- Monitoring dashboards in Grafana
- Export metric data to BigQuery
- Create and share dashboards with programmatic REST and gRPC syntax
- Efficient than hand-created dashboards from scratch
External Integration Use Cases
- Keep metrics for long-term analysis/storage
- Cloud Monitoring holds metrics for six weeks
- Share metric data with other analytic platforms (e.g. Grafana)
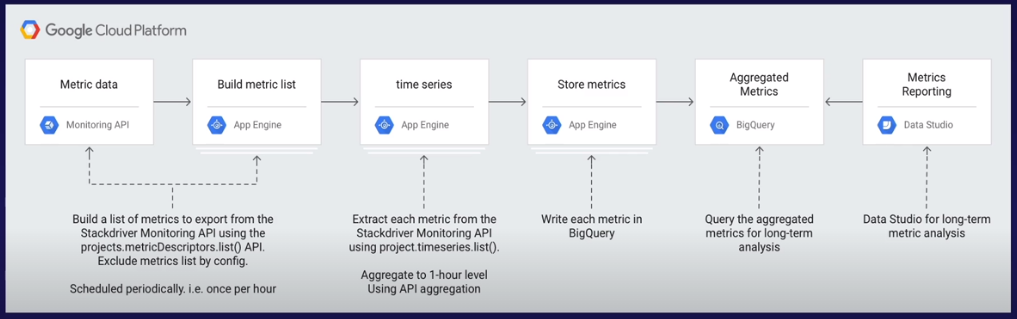
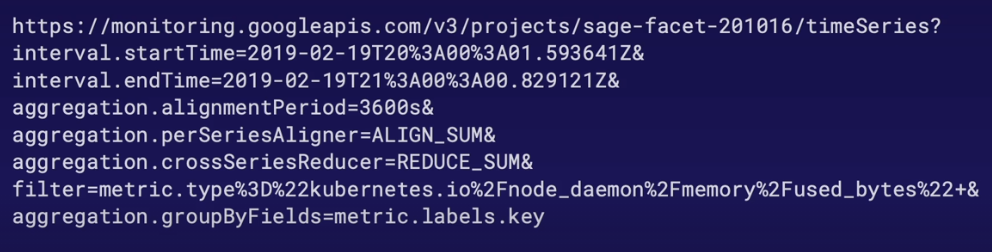
How does Metrics Integration Work?
- Short version: Export/Integrate via Cloud Monitoring API
- If exporting metrics:
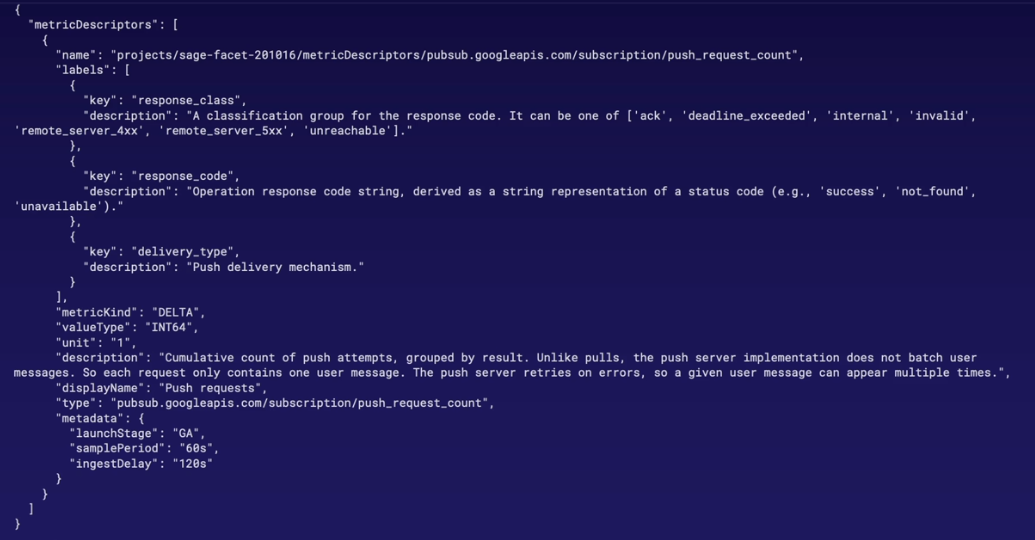
- Define metrics with metric descriptor (JSON format)
- Export via Monitoring API to BigQuery
- If using 3rd Party service (e.g. Grafana), authenticate to Cloud Monitoring API with service account
Programmatically Create Dashboards
- Create and export dashboard via Monitoring API
- Dashboard configuration represented in JSON format
- Create dashboards and configurations via
gcloudcommand or directly via REST API gcloud monitoring dashboards create --config-from-file=[file_name.json]
Create Dashboards with Command Line
- Create custom dashboards via command with JSON config files
- Use both gcloud command or directly via REST API
- Export current dashboard into JSON configuration file
This is cool, because we can create and hold our dashboards under source control
- Download configuration file
wget https://raw.githubusercontent.com/GoogleCloudPlatform/monitoring-dashboard-samples/master/dashboards/compute/gce-vm-instance-monitoring.json
- Create dashboard with gcloud command and config file:
gcloud monitoring dashboards create --config-from-file=gce-vm-instance-monitoring.json
- Do same thing via REST API
curl -X POST -H "Authorization: Bearer $(gcloud auth application-default print-access-token)" \
-H "Content-Type: application/json; charset=utf-8" \
https://monitoring.googleapis.com/v1/projects/(YOUR-PROJECT-ID-HERE)/dashboards -d @gce-vm-instance-monitoring.json
- Export current dashboard
Create shell variables for Project ID and Project Number
export PROJECT_ID=$(gcloud config list --format 'value(core.project)')

export PROJECT_NUMBER=$(gcloud projects list --filter="$PROJECT_ID" --format="value(PROJECT_NUMBER)")
- Export dashboard using above variables. Substitute your dashboard ID and exported file name where appropriate Export current dashboard by dashboard ID
gcloud monitoring dashboards describe \
projects/$PROJECT_NUMBER/dashboards/$DASH_ID --format=json > your-file.json
GKE Metrics
- "Enable Cloud Operations for GKE" - Simple tickbox to turn on
_ GKE natively integrated with both Cloud Monitoring and Logging
- Ability to toggle 'Cloud Operations for GKE' in cluster settings, enabled by default
- Cloud Operations for GKE replaces older 'Legacy Monitoring and Logging'
- Integrates with Prometheus
What K8's Metrics are Collected?
- k8s_master_component
- k8s_cluster
- k8s_node
- k8s_pod
- k8s_container
If you need a 'one-click' script to build out a demonstration GKE web application from scratch, copy and paste the below command. It will download and execute a script to build out the environment. The process will take about five minutes to complete:
wget https://raw.githubusercontent.com/linuxacademy/content-gcpro-devops-engineer/master/scripts/quick-deploy-to-gke.sh

source quick-deploy-to-gke.sh
Perspective: What's Up, Doc?
- Uptime checks are very valuable
Uptime Checks
What are Uptime Checks?
-
Periodic request sent to a monitor resource and waits for a response (or is "up")
-
Check uptime of:
- VMs
- App Engine services
- Website URLs
- AWS Load Balancer
-
Create uptime check via Cloud Monitoring
-
Optionally, create an alert to notify is uptime check fails
-
IMPORTANT: Uptime checks are subject to firewall access
- Allow access to the uptime check IP range
Establishing Human-Actionable and Automated Alerts
Why do we care about Alerts?
- Sometimes, things break
- No one wants to endlessly stare at dashboards for something to go wrong
- Solution: Use Alerting Policy to notify you if something goes wrong
Alerting Policy Components
- Conditions - describes conditions to trigger an alert
- Metrics threshold exceeded/not met
- Create an incident when thresholds are violated
- Notifications - who to notify when the alerting policy is triggered
- (optional) - Documentation - included in notifications with action steps
Incident Handling
- Alerting event occurs when alerting policy conditions are violated
- Creates Incident in Open state
- Incident can then be Acknowledged (investigated) and Closed (resolved)
Alerting Policy IAM Roles
- Uses Cloud Monitoring roles to create an alerting policy
- Monitoring Editor, Admin, Project Owner
- Monitoring Alert Policy Editor - minimal permissions to create an alert via Monitoring API
GCP creates actual incidents under alerts, that you can "resolve"
Section Review
Monitoring Your Operations
- Cloud Monitoring Concepts
- Monitoring Workspaces
- What are Metrics?
- Exploring Workspaces and Metrics
- Monitoring Agent
- Monitoring API and CLI usage
- GKE Metrics - Master to individual containers
- Uptime Checkes
- Establishing Human-Actionable and Automated Alerts
Milestone: Spies Everywhere! (Check Those Vitals!)
Hands-On Lab: Install and Configure Monitoring Agent with Google Cloud Monitoring
Logging Activities
Section Introduction
Logging Activities: See next headings
Cloud Logging Fundamentals
What is Cloud Logging?
- Cloud Operations service for storing, viewing, and interacting with logs:
- Reading and writing logs entries
- Query logs
- Export to other services (internal to GCP and external)
- Create metrics from logs
- Interact with Logs Viewer and API
- Multiple log types available
- Logs used by other Cloud Operations services (debug, error reporting, etc)
What is a log?
- Record of status or event (string format)
- "What happened?"
- Log Entry - individual logs in a collection
- Log Payload - contents of the Log Entry
- Contains nested Fields
Logs Retention Period
- Varies by log type:
- Admin Activity, System Event, Access Transparency
- 400 days
- Non-configurable
- All other log types:
- 30 days by default
- Configurable retention period
- Admin Activity, System Event, Access Transparency
IAM Roles
- Generic and service account varieties
- Service Account:
- Logs Writer: Write logs, no view permissions
- Logs Bucket Writer: Write logs to logs buckets
- Logs Viewer - View logs except Data Access/Access Transparency (known as private logs)
- Private Logs Viewer - View all of the above
- Logs Configuration Writer - Create logs-based metrics, buckets, views and export sinks
- 'Change configruations'
- Logging Admin - Full access to all logging actions
- Project Viewer - View all logs except Data Access/Access Transparency
- Project Editor 0 Write, view and delete logs. Create logs-based metrics
- Cannot create export sinks or view Data Access/Access Transparency logs
- Project Owner - all logging-based permissions
Log Types and Mechanics
Scope of Collecting and Viewing Logs
- Scoped by project
- View
project-1logs inproject-1 - No built-in "single pane of glass"
- Can export logs org-wide or multiple projects
Log Types - Primary Categories Security Logs vs. Non-security Logs Always Enabled (non-configurable) vs. Mnaually Enabled (configurable):
- Always Enabled/REquired
- No change
- 400 days retention
- Manually Enabled logs
- Charged based on log amount
- 30 days retention (configurable) Above categories overlap
Security Logs
Audit logs and Access transparency logs
- "Who did what? where? and when?"
- Also accessible via Activity Log
Admin Activity | System Event | Data Access
Admin Activity
- Records user-initiated resource configuration
- "GCE instance created by (user)"
- "GCS Bucket deleted by (user)"
- Always Enabled
System Event
- Admin (non-user) initiated configuration calls
- Always Enabled
Data Access
- Record configuration (create/modify/read) of resource data
- "Object (x) was created in bucket (y) by (users)"
- Must be manually enabled (except BigQuery)
- Not applicable to public resources
Access Transparency Logs
- Only applicable for Enterprise or paid support plans
- Logs og Google personnel access to your resources/data
- Example: Support request for VM instance
- Records action and access of support personnel
- Always Enabled for applicable support plans
| Log Type | System or User configured | Records what? | Default Setting |
|---|---|---|---|
| Admin Activity | User-initiated | Resource Configuration | Always Enabled |
| System Event | System-initiated | Resource Configuration | Always Enabled |
| Data Access | User-initiated | Resource Data Configuration | Manually Eanble |
| Access Transparency | User-initiated | Google personnel access | Always Enabled (on applicable support plans) |
'Everything Else' Logs
Logs to Debug, Monitor and Troubleshoot:
- Chargeable
- User Logs - generated by software/applications
- Require Logging Agent
- Platform logs - logs generated by GCP services
- Example: GCE startup script
- VPC Flow Logs
- Firewall Logs
Logs Pricing and Retention
- Always Enabled logs have no charge with 400 days retention
- Admin Activity, System Event, Access Transparency
- ALL other logs are chargeable with configurable retention period (default 30 days)
- Pricing = $0.50/GB
Cloud Logging Tour
Data access logs - Add, edit, view object in a bucket
- Enabled through IAM > Audit Logs
- To enable on single service, find the service e.g. Google Cloud Storage, tick Admin Read, Data Read, Data Write
- Can add exempted users e.g. Admin user
- To enable on single service, find the service e.g. Google Cloud Storage, tick Admin Read, Data Read, Data Write
Logging Agent Concepts
- Agent captures additional VM logs
- OS logs/events
- 3rd Party application logs
- Logging agent-based on fluentd (open source data collector)
- Only applicable to GCE and EC2 (AWS)
- GKE uses Cloud Operations for GKE
Configuring the Agent
- Per Google: The "out of the box" setup covers most use cases
- Default installation/configuration covers:
- OS Logs
- Linux - syslog
- Windows - Event viewer
- Multiple 3rd party applications e.g. Apache, nginx, redis, rabbitmq, gitlab, jenkins, cassandra etc
- OS Logs
Modifying Agent Logs Before Submission
- Why modify logs?
- Remove sensitive data
- Reformat log fields (e.g. conbine two fields into one)
- Additional configuration "plug-ins" can modify records
filter_record_transformer- most common- Add/modify/delete fields from logs
Agent Setup Process
- Add Repo (via provided script)
- Update repos
- Install Logging Agent
- Install configuration files
- Start the agent
Install Logging Agent and Collect Agent Logs
curl -sSO https://dl.google.com/cloudagents/add-logging-agent-repo.sh
sudo bash add-logging-agent-repo.sh
sudo apt update
sudo apt-get install google-fluentd
sudo apt install -y google-fluentd-catch-all-config
sudo service google-fluentd start
Logging Filters
Logs Viewer Query Interface
- View logs through queries
- Basic and Advanced query interface
- Basic
- Dropdown menus - simple searches
- Advanced
- View across log categories - advanced search capabilities
Basic and Advanced Filter Queries
- Different query formats
- Search field syntax fifferent for each method
- Basic query
- Not case-sensitive
- Built in field names for some logs
Advanced Filter Boolean Operators
- Group/Exclude entries
- AND requires all conditions are met
- OR requires only one condition to be met
- NOT excludes condition
- Order of precendence (i.e. order of operations)
- NOT -> OR -> AND
- a OR NOT b AND NOT c OR d = (a OR (NOT B)) AND ((NOT C) OR d)
- AND is implied
Constructing Advanced Fitler Queries
- Generic text search = just type requested string
- Searching fields
- Nested JSON format
- resource.type="gce_instance"
- resource.labels.zone="us-central1-a"
- Nested JSON format
- Search by set severity or greater
severity >= WARNING
- Filter by timestamp
timestamp>="2018-12-31T00:00:00Z" AND timestamp<="2019-01-01T00:00:00Z"
Hands-On with Advanced Filters
- Create advanced search filters
- Search across log types
- Use AND, OR and NOT operators
- Explore new Logging interface
VPC Flow Logs
What are VPC flow Logs?
- Recorded sample of network flows sent/received by VPC resources
- Near real-time recording
- Enabled at the VPC subnet level
Use Cases
- Network Monitoring - Understanding traffic growth for capacity forecasting
- Forensics - who are your instances talking to?
- Real-time security analysis
- Integrate (i.e. export) with other security products
VPC Flow Logs - Considerations
- Generates a large amount of, potentially chargeable, log files
- Does not capture 100% of traffic:
- Samples approximately 1 out of 10 packets. This cannot be adjusted
- TCP/UDP only
- Shared VPC - all VPC flow logs are in the host project
Firewall Logs
What are Firewall logs?
- Logs of firewall rule effects (allow/deny)
- Useful for auditing, verifying, and analyzing effect of rules
- Applied per firewall rule, across entire VPC
- Can be exported for analysis
Considerations
- Logs every firewall connection attempt - best effort basis
- TCP/UDP protocols only
- Default "deny all" ingress and "allow all" egress rules are NOT logged
Viewing Deny/Allow All Logs?
- Create an explicit firewall rules for the denied/allowed traffic you want to view - e.g. A duplicate rule to the default rule
- Example: View all SSH attempts from outside of an allowed location
- Create a rule to deny all TCP:22 access from all locations - enable logging
- Assign low priority figure of 65534
- Assign higher priority "ssh-allow" rule for allowed location in source filter
VPC Flow Logs and Firewall Logs Demo
Routing and Exporting Logs
- Main premise - route a copy of logs from Cloud Logging to somewhere else
- BigQuery, Cloud Storage, Pub/Sub, another logging bucket and more
- Can export all logs, or certain logs based on defined criteria
Why Route/Export logs?
- Long-term retention
- Compliance requirements
- Big data analysis
- Analytics in BigQuery
- Stream to other applications
- Pub/Sub connection
- Route to alternate retention buckets
How Routing/Exports Work
- 3 components: Sink, Filter, Destination
- Create a sink
- Sink = Object for filter.destination pairing
- Create filter (query) of logs to export
- Can also set exclusions within filter
- Set destination for matched logs
- Export will only capture new logs since the export was created, not previous ones
Export logs across Folder/Organization
Must use command line (or terraform), cannot create via the web console
gcloud logging sinks create my-sink \
storage.googleapis.com/my-bucket --include-children \
--organization=(organization-ID) --log-filter="logName:activity"
Logging Export IAM Roles
- Owner/Logs Configuration Writer - create/edit sink
- Viewer/Logs Viewer - view sink
- Project Editor does NOT have access to create/edit sinks
Export Logs to BigQuery
In this Demo...
Export firewall logs to BigQuery, and analyze access attempts
- Create a sink
- Filter by firewall logs
- Set BigQuery dataset as destination
- Run queries in BigQuery to view denied access attempts
#standardSQL
SELECT
jsonPayload.connection.src_ip,
jsonPayload.connection.dest_port,
jsonPayload.remote_location.continent,
jsonPayload.remote_location.country,
jsonPayload.remote_location.region,
jsonPayload.rule_details.action
FROM `log_export.compute_googleapis_com_firewall`
ORDER BY jsonPayload.connection.dest_port
Logs-Based Metrics
What are logs-based metrics?
- When is a log not just a log?
- When it is also a Cloud Monitoring metric!
- Cloud Monitoring metrics based on defined log entries
- Example: number of denied connection attempts from firewall logs
- Metric is created each time log matches a defined query
- System (auto-created) and User-defined (custom) varieties
Types of logs-based metrics
Counter and Distribution
Counter:
- Counter of logs that match an advanced logs query
- Example: number of logs that match specific firewall log query
- All system logs-based metrics are counter type
Distribution:
- Records distribution of values via aggregation methods
From logs viewer > Create Metric or Logs based Metrics menu
Section Review
Milestone: Let the Record Show
Custom logs based distribution metrics
- More powerful, collects a number value for each event and shows you how those values are distributed over the set of events
- Common use is to track latency
- from each event received, a latency value is extracted from the log entry and added to the distribution
- Concept of percentile is fundametaly about percentile
- from each event received, a latency value is extracted from the log entry and added to the distribution
- Common use is to track latency
Hands-On Lab: Install and Configure Logging Agent on Google Cloud
SRE and Alerting Policies
SLOs and Alerting Strategy
Required Reading
- Google SRE Workbook - "Alerting on SLO's"
- https://sre.google/workbook/alerting-on-slos/
Alerts Review - Why we need them
- Something is not working correctly
- Action is necessary to fix it
- Alerts inform relevant personnel that action is necessary when specified conditions met
Alerts and SRE
- Continued errors = Danger of violating SLAs/SLOs (error budget being used up)
- If issue isn't fixed, error budget will be used up
- Proper alerting policy based on Service Level Indicators (SLIs) enables us to preserve error budget
- Balance multiple alerting parameters
Precision | Recall | Detection time | Reset time
- Precision: Rate of 'relevant' alerts vs. low priority events
- Does this event require immediate attention?
- Recall: Percent of significant events detected
- Was every 'real' event properly detected? Did we miss some?
- Detection time: Time taken to detect significant issue
- Longer detection time = more accurate detection, but longer duration of errors before
- Reset time: How long alerts persist after issue is resolved
- Longer reset time = confusion/'white noise'
How do we balance these parameters?
- Window Length: Time period measured
- % of errors over (x) time period
- Example: average CPU utilization per minute vs. per hour
- Small windows = faster alert detection, but more 'white noise'
- CPU averaging 80% for 1-minute window
- Hurts precision, helps recall
- Longer windows = More precise ('real' problem vs. white noise)
- CPU Averaging 95% for 1-hour window
- Longer detection time
- Good precision, poor detection time
- Once problem determined, more error budget may already be used up
- % of errors over (x) time period
- Duration: How long something exceeds SLIs before 'significant' event declared
Forfield e.g. 1 minute, is the duration- Short 'blips' vs. sustained errors over longer time period
- Reduced 'white nose'
- Poor recall, good precision
- Outage of 2 minutes on 5 min duration never detected
- Misses massive spikes in errors over shorter durations
Optimal Solution - Multiple conditions/notification channels
- No one single alerting policy/condition can properly cover all the scenarios
Google Recommends (Condensed from the multi-page doc listed in required reading)
- Multiple conditions
- Long and short time windows
- Long and short durations
- Multiple notification channels based on severity
- Low priority anomalies to reporting system
- Pub/Sub topic to analysis application to look for trends
- No immediate human interaction required
- Major (customer-impacting) events to on-call team
- Requires immediate escalation
- Low priority anomalies to reporting system
Service Monitoring
wget https://raw.githubusercontent.com/linuxacademy/content-gcpro-devops-engineer/master/scripts/app-engine-quick-deploy.sh source app-engine-quick-deploy.sh
Not in exam, but interesting
GCP Console > Operations > Services
Create SLO
- Latency (App Engine)
- Request-based - simply counts individual events (Windows-based is more advanced, good mins vs bad mins, entries above/below the SLI)
- Define SLI
- Latency Threshold - 200ms - Response time, all our requests have to exceed to be within the SLI
- Set your SLO based on SLI
- Compliance period: Calendar : 1-day, Rolling = Any 24hr period
- Performance Goal: 80% of good response time requests e.g. 80% of our customer requests must be 200ms or less
- Changing this value up e.g. to 99% will affect the error budget (bring it down), that's because some requests exceed 200ms response time
- Name: Average Customer latency - 80% SLO
Milestone: Come Together, Right Now, SRE
The services console is really valuable, because when setting the SLO, GCP already has the historical data and can show you instant feedback when determining your SLO (P95 value) - Automation built into GCP console reducing risks human might make when adding up.
- Really great tool, not manually calculating error budgets, GCP does it all for you!
Optimize Performance with Trace/Profiler
Section Introduction
What the Services Do and Why They Matter
Cloud Trace
"A Distributed tracing system that collects latency data from your applications and displays it in the GCP Console"
Operational Management
- Latency Management
Google's 4x Golder Signals
- Latency
Cloud Trace: Primary Features
- Works with App Engine, VMs and container (e.g. GKE, Cloud Run)
- Shows general aggregated latency data
- Shows performance degradations over time
- Identifies bottlenecks
- Alerts automatically if there's a big shift
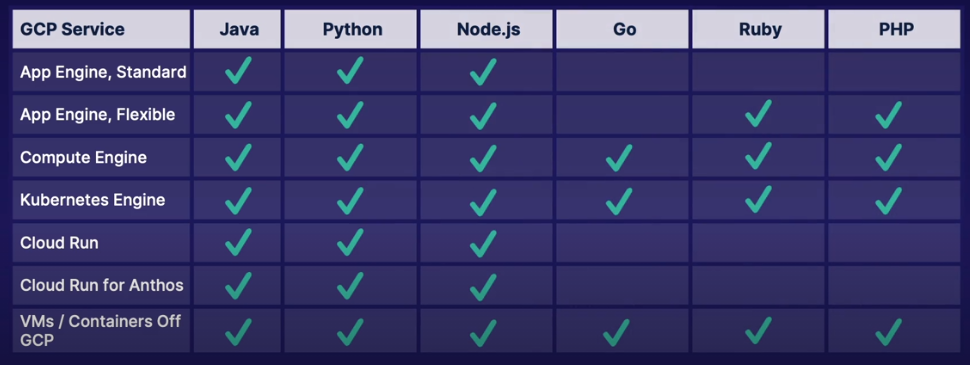
- SDK supports Java, Node.js, Ruby and GO
- API Available to work with any source
Cloud Profiler
"Continuously analyzes the performance of CPU or memory-intensive functions executed across an application"
Cloud Profiler: Primary Features
- Improve performance
- Reduce costs
- Supports Java, Node.js, Python and Go
- Agent-based
- Extremely low-impact
- Profiles saved for 30 days
- Export profiles for longer storage
- Free!
Types of Profiling Supported
| Profile Type | Go | Java | Node.js | Python |
|---|---|---|---|---|
| CPU time | X | X | - | X |
| Wall time | - | X | X | X |
| Heap | X | X | X | - |
| Allocated Heap | X | - | - | - |
| Contention | X | - | - | - |
| Threads | X | - | - | - |
CPU Time - Time it takes the processor to run whatever function (in code) is being processed Wall Time - Total time (Wall clock time); Time elapsed between entering and exiting a function includes all wait time, locked and thread syncronisation Heap - Amount of memory, allocated in the programs heap at the instant the profile is collected Heap Allocation - Total amount of memory that was allocated in the programs heap during the interval between the first collection and the next collection. This value includes any memory that was allocated any has either been freed or is no longer in use Contention - Go specific - Profile mutex contention for Go, mutual exclusion lock, data access across concurrent processes. Determine the amount of time waiting for mutexs and frequency at which contention occurs Threads - Profile thread usage for Go, and capture the information on Go routines, and Go concurrency mechanisms
Tracking Latency with Cloud Trace
Set up a sample app that utilizes a Kubernetes Engine cluster and three different services to handle a request and generate a response, all the while tracking the latency with Cloud Trace. Once we’ve made a number of requests, we’ll examine the results in the Cloud Trace console and I’ll show you how you can check the overall latency of the request as well as breaking it down into its component parts.
Traces are gathered at every step, e.g. across each of the 3x load balancers
Enable K8's engine API Enable Cloud Trace API
Python Code for Cloud Trace Middleware
Python Code for Cloud Trace Execute Trace
Everytime the app executes, the trace executes
Dashboard outputs the full trace, with waterfall graph showing component parts (spans - to help identify latency bottlenecks)
Accessing the Cloud Trace APIs
Instrumenting Your Code for Cloud Trace
3x methods
| Client Libraries | Open Telemetry | OpenCensus |
|---|---|---|
| Ruby | Node.js, Python (now) | Python |
| Node.js | Go | Java |
| C# ASP.NET Core | In Active development | Go |
| C# ASP.NET | Recommended by Google | PHP |
Comparing APIs
| V1 | vs | V2 |
|---|---|---|
| Send traces to Cloud Trace | - | Send traces to Cloud Trace |
| Update existing traces | - | - |
| Get lists of traces | - | - |
| get the details of a single trace | - | - |
| Supports v1 REST and v2 REST as well as v1 and v2 RPC | - | Supports v1 REST and v2 REST as well as v1 and v2 RPC |
| A trace is represented by a Trace resource (REST) and Trace message (RPC) | - | No explicit trace object; include trace ID in span to identify |
| A span is represented by a TraceSpan resource (REST) and TraceSpan message (RPC) | - | A span in represented by the Span resource |
| Uses Labels fields | - | Uses attributes fields |
Setting Up Your App with Cloud Profiler
Cloud Profiler Supported Environments
- Compute Engine
- App Engine Standard Environment
- App Engine Flexible Environment
- Kubernetes Engine
- Outside of Google Cloud
Python Code to enable Cloud Profiler to track CPU
3 Steps to Setting up Cloud Profiler Outside GCP
- Enable profiler API inside GC Project
- Get credentials for the profiling agent
- Service account with private-key auth
- Application default credentials (ADC)
- Configure the agent
- Pass in the project ID via a
Config()or similar method
- Pass in the project ID via a
Analyzing Cloud Profiler Data
As Go is the most supported language, the demo in this video uses Go.
TLDR: Analyze Code with graphs, IO, CPU, locks, etc, cool if you're coding with running your apps within GKE or on GCP
Section Review
Cloud Trace: Latency - Demo app with 3x Load Balancers, Spans, OpenTelemetry Cloud Profiler: Continuously analyzing CPU & Memory Performance, Supported services, Code necessary for implementation, Examine flame graphs for profile types, threads, alloc etc
Milestone: It All Adds Up!
Hands-On Lab: Discovering Latency with Google Cloud Trace
- Stand-up infrastructure
gcloud services enable cloudtrace.googleapis.com
gcloud services enable container.googleapis.com
gcloud container clusters create cluster-1 --zone us-central1-c
gcloud container clusters get-credentials cluster-1 --zone us-central1-c # If created through the WebUI
kubectl get nodes
-
Update
[PROJECT_ID]in./trace/acg-service-*.yaml*.templatewithin the cloned repo -
Build Container Image, Tag and push to container registry
docker build -t acg-image .
docker tag acg-image gcr.io/discovering--219-46060d10/acg-image
docker push gcr.io/discovering--219-46060d10/acg-image
I fucked the deployment by changing the tag in the deployment. The tag is referenced in the
deploymentspec under./trace/app/acg-service-(a|b|c).yaml
You can force refresh containers after fixing (re-tag, re-push) the issue
cloud_user_p_cff0f65a@cloudshell:~/content-gcpro-operations/trace (discovering--219-46060d10)$ kubectl rollout restart deployment/cloud-trace-acg-c
deployment.apps/cloud-trace-acg-c restarted
cloud_user_p_cff0f65a@cloudshell:~/content-gcpro-operations/trace (discovering--219-46060d10)$ kubectl get all
NAME                                     READY   STATUS              RESTARTS   AGE
pod/cloud-trace-acg-a-5f49648db7-ztjr5   1/1     Running             0          20s
pod/cloud-trace-acg-b-6966b8cb56-ztnvh   1/1     Running             0          4s
pod/cloud-trace-acg-b-bb7c98995-bfgld    0/1     Terminating         0          16m
pod/cloud-trace-acg-c-66497849b7-xlvjm   1/1     Running             0          16m
pod/cloud-trace-acg-c-6d5d5b489d-bwdbr   0/1     ContainerCreating   0          2s
- Run
setup.shscript
bash setup.sh
- Test the app
curl $(kubectl get svc cloud-trace-acg-c -ojsonpath='{.status.loadBalancer.ingress[0].ip}')
Identifying Application Errors with Debug/Error Reporting
Section Introduction
Troubleshooting with Cloud Debugger
"Inspect code in real time, without stopping or slowing it down" (killer feature)
- Multiple Source Options
- Cloud Source repositories
- GitHub
- BitBucket
- GitLab
- Code Search
- Quickly find code in a specific file, function, method or by line number
- Code Share
- Debug sessions can be shared with any teammate for collaborative debugging
- IDE Integration
- Integrates with IntelliJ IDE, as well as VSCode and Atom
Completely Free to Use
Key Workflows
Two Key Cloud Debugger Tools
| Snapshots | vs. | Logpoints |
|---|---|---|
| - Captures application state at a specific line location | - | - Inject logs into running apps without redeployment |
| - Captures local variables | - | - Logpoints remain active for 24 hours if not deleted or service not redeployed |
| - Captures call stack | - | - Supports canarying |
| - Take snapshots conditionally (Java, Python and Go) | - | - Add Logpoints conditionally |
| - Supports canarying | - | Output ent to target's appropriate environment |
Demo of Code debugging in Python
Establishing Error Reporting for Your App
Error Reporting Supported Languages
-
php
-
Java
-
Python
-
.NET
-
Node.js
-
Ruby
-
Go
-
Compute Engine
- Cloud Logging
- Error Reporting API
-
App Engine
- Automatic set-up
- Standard Environment:
- Additional set-up may be neccessary
- Only errors with stack trace processed
- Flexible Environment:
- No additional setup required
- Analyzes messages to stderr
-
Cloud Run
- Automatic setup
- Analyzes messages written to stderr, stdout, or other logs that have stack trace
-
Kubernetes Engine
- Use Cloud Logging
- Use Error Reporting API
-
Cloud Functions
- Automatic setup
- Unhandled JavaScript exceptions processed
Working with the Error Reporting API in Python
- Import
error_reportinglibrary - Instantiate
Client() - Call
report()method, passing in any string
Python example in Video
Managing Errors and Handling Notifications
Error Reporting Entries Explained
Occurances (withing selected time/day range) Users affected (Within selected time/day range) Error (Extracted from stack trace with code location, linked if in CSR) Seen In (service and version, if any) First Seen (time/date first appeared) Last Seen Response Code (HTTP Status code, if any) Link to issue URL (Optional text field)
Error Reporting Notifications
- Enabled per project
- Must have Project Owner, Project Editor, Project Viewer role, or custom role with
cloudnotifications.activities.listpermission - Sent to email of specified roles
- May be forwared to alias or Slack channel
- Send to mobile app, if enabled and subscribed (Cloud Console App)
Section Review
Milestone: Come Together - Reprise (Debug Is De Solution)
Hands-On Lab: Correcting Code with Cloud Debugger
gcloud services list --available | grep -i debug
gcloud services enable clouddebugger.googleapis.com
git clone https://github.com/linuxacademy/content-gcpro-operations
cd content-gcpro-operations/debugger/
gcloud app deploy # This failed first time, as GCP hadn't finished setting up services, just re-run and was successful
gcloud app browse # Opens link to the app
- Update Code because
gurufails to return properly reversed
Fix code using debugger, set info point and use breakpoints